Rosendahl, W., Morgan, M. & López Correa, M. (eds.) (2002): Cave-Bear-Researches / Höhlen-Bären-
Forschungen. – Abhandlungen zur Karst- und Höhlenkunde, 34: 70-73, München.


Kerstin Athen: 
 
Short report about biometrical research 
on postcranial elements of fossil ursids


Concise description of the PhD project
The project includes extensive measurements on postcranial elements of Ursus spelaeus, U.
deningeri and U. etruscus of different sites, primarily of collections in Germany, but also of
other European countries. For the time being measurements have been chosen mainly for long
bones and metapodial bones of adult individuals (16 different objects) on the basis of
DUERST (1926) and VON DEN DRIESCH (1976). Matrices of data-sets were developed for
each object, in which the data of definitely identified remains was entered. The amount of
measurements per object vary between 8 and 24 variables each, 244 endpoints altogether,
with a maximum of 40 repetitions per object and site. The data is statistically analysed with
the computer-programs SAS, SPSS and Excel. During the current main statistical analysis the
number of endpoints (amount of measurements) is to be minimized, if possible, so in future
less time will be needed for measuring.
Although it is not the main matter of concern in this project, data of recent European brown
bears and polar bears has also been raised. Even though it is not yet enough for decent
statistical analysis and interpretation, this data has been included in the following example.
All data will be expanded in future.
The purpose of this briefly described project is to help interpreting the relationship between
the fossil ursids mentioned above. The intention is to show the variability of the examined
species and the differences between them, based on selected postcranial material. Especially
the distinction between Ursus spelaeus and U. deningeri by further definite distinctive marks
on postcranial elements, and to grasp these marks statistically, is the aim of this project.


UP
Statistical Analysis
First, endpoints have to be found, which show approximate homogeneous measurements
within each group of species. Afterwards, from these endpoints the ones have to be selected,
which allow a best classification between the species. To select the correct statistical test for
this kind of data, first of all it is necessary to find out whether the data is approximately
gaussian distributed or not. For this purpose a list was calculated with summary statistics like
minimum, maximum, mean, median and standard deviation with help of a SAS (Statistical
Analysis System) procedure. In addition, for each endpoint data boxplots were raised,
measurements split by species. These descriptive statistical methods showed in the pre-
examination that some of the data is approximately gaussian distributed, others is not. This
result allows the usage of Kruskal-Wallis-Test and other suitable multiple tests for these
independent sample surveys. To look for significant differences between the investigated
groups (sites split by species), for each of the 244 endpoints (measurements) the Kruskal-
Wallis-Test was used for each of the data-sets. All these tests in the pre-examination showed
that within the group of Ursus spelaeus proportions stay more or less equal, despite their high
variability in size. These calculations were the preparation for the main examination, where
the aim is to show that the data-sets within one group (e.g. Ursus spelaeus or Ursus
deningeri) are homogeneous and in some of the measurements or proportions significantly
different between the investigated groups. Concluding, it appeared to be necessary to choose
statistical procedures in the main examination, which are able to handle small sample sizes.
The next step, based on the above described, was taken in the main examination by Pivottables
and diagrams, which give a first impression of the data. One example for statistical
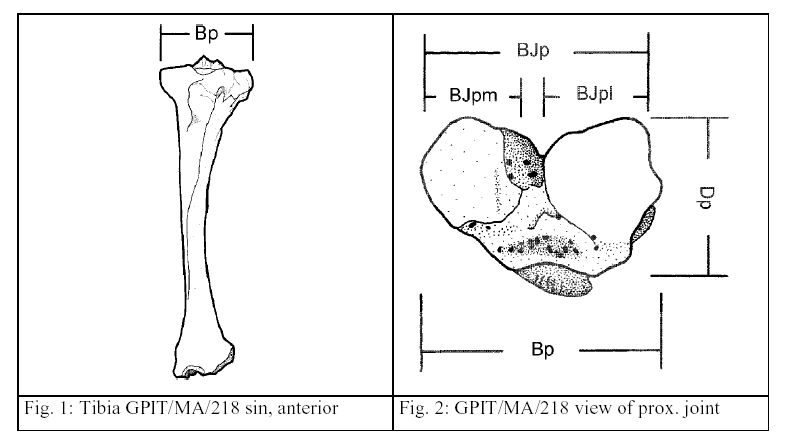
approach is presented in the following (fig. 1 - fig. 4), where two correlated measurements are
applied to each other.


UP
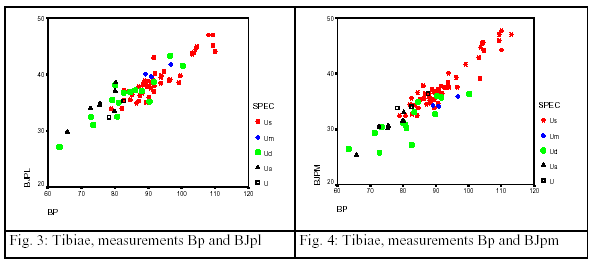
In the figures 3 and 4 the proximal breadth (Bp) of tibiae is on the one hand applied to the
breadth of the medial part of its joint (BJpm) and on the other hand to the lateral part of its
joint (BJpl). (See abbreviations on the last page.) These figures show that the clustering data
of Ursus deningeri is around the sparse data of Ursus arctos, the data of Ursus spelaeus lies
slightly ahead of that. This implies that in these endpoints there might be a distinctive mark
between the main fossil groups, which needs to be proved by additional statistical tests. Also,
it will be necessary to raise more data, in order to avoid problems with small sample sizes.


For the time being finding further differences between Ursus deningeri and U. spelaeus,
which become statistically apparent, like the one described in figure 3 and 4, is the main
emphasis during the current analysis. Especially differences in proportions of the two main
groups are looked for, which are probably most meaningful. On the one hand this is contrived
by capturing usual indices, on the other hand with extensive multivariate analysis. Indices as
well as variable-sets, which prove to be especially characteristic in the analysis of
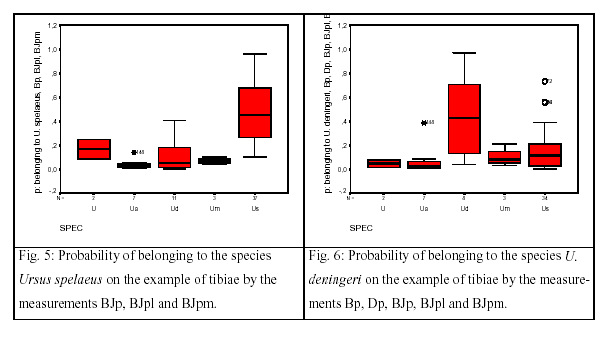
discriminance, shall be used for identification of the species. Figure 5 and 6 show two
examples for the analysis of discriminance.


UP
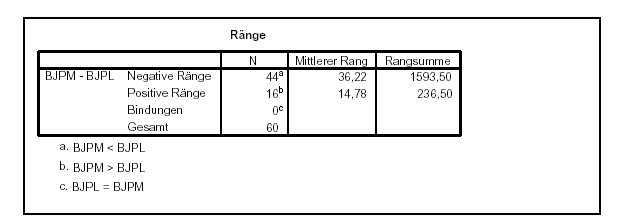
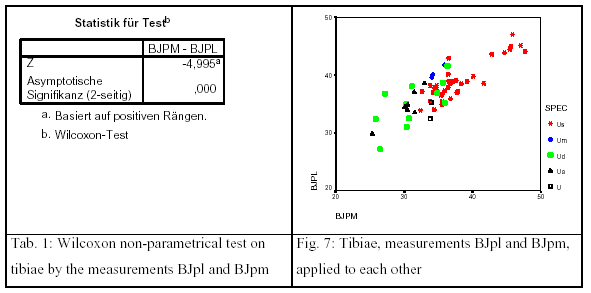
Sticking to the example of measurements on the proximal joint of tibiae, Wilcoxons nonparametrical
test (npar1way procedure) is looking for pair-differences in the case of
dependent samples and can be used for associated random samples (see tab. 1, fig. 7).
UP
   
Table 1 shows that out of 153 objects, which is the whole data-set of tibiae so far, only 60 are
associated samples in the variables BJpm and BJpl. Of these 60 associated samples in 44
cases BJpm is smaller than BJpl. In the remaining 16 cases measurements of BJpm are larger
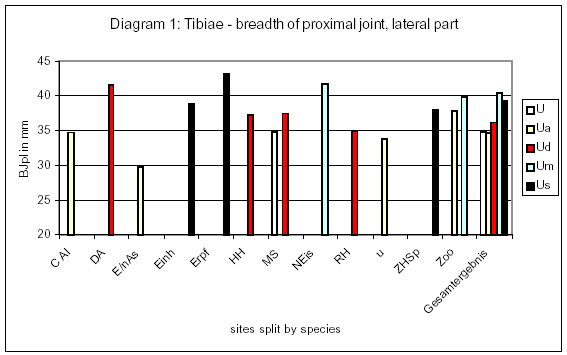
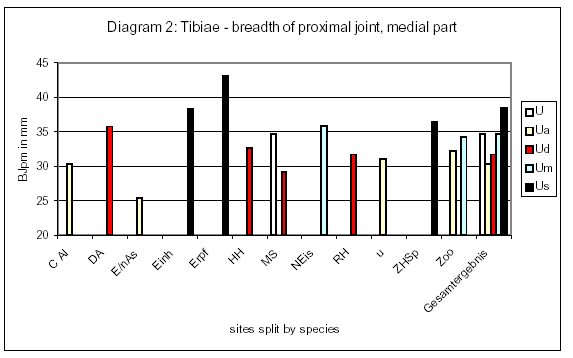
than BJpl. In none of the 60 cases both measurements have the same size. Figure 7, diagrams
1 and 2 show this effect graphically.
In diagrams 1 and 2 in almost all cases BJpl is much larger than BJpm in Ursus arctos, U.
deningeri and U. maritimus, in contrast to data of Ursus spelaeus. On closer examination it is
ascertainable that the rarer relationship ‘BJpm larger than BJpl’ is unequally distributed
among this species of different sites. Of 37 associated samples of U. spelaeus there are 14
samples with the relationship ‘BJpm larger than BJpl’, which means the biggest share out of
the above mentioned 16. The question is which group is especially affected. On even closer
examination, this remarkable relationship cannot be assigned to a particular gender, although
there is a hint that it might have to do with the body size. Up to 10 out of the 16 tibiae with
this relationship probably used to belong to male individuals, judged by the greatest length of
the bone, the shaping of muscle impression and the robustness of the bones. This needs to be
tested again in a later examination with even larger data-sets.
UP

UP
Outlook
This article was compiled at the beginning of the main statistical analysis. By the time of the
International Symposium there will be more information presented.
For the final examination the basis of all data-sets will be extended and the choice of variables
used in the statistical analysis will be improved. Especially further data-sets of Ursus
etruscus, but also of U. deningeri, are needed most for the final solid statistical analysis.


Abbreviations
Bp = proximal breadth
Dp = proximal depth
BJp = breadth of complete proximal joint
BJpm = breadth of proximal joint, medial part
BJpl = breadth of proximal joint, lateral part
Spec = species
U = Ursus n. sp.
Ua = U. arctos
Ud = U. deningeri
Um = U. maritimus
Us = U. spelaeus


References
DUERST, J.U. (1926): Vergleichende Untersuchungsmethoden am Skelett bei Säugern. - In:
ABDERHALDEN: Handbuch der biol. Arbeitsmethoden, Abt. 7: Methoden der
vergleichenden morphologischen Forschung, Heft 2: 125-530, Berlin, Wien.
VON DEN DRIESCH, A. (1976): A guide to the measurement of animal bones from
archaeological sites. - Peabody Museum Bulletin 1: 1-137 (Peabody Museum of
Archaeology and Ethnology Harvard University).


Dipl. Geol. Kerstin Athen
Marschnerstr. 45
D – 30167 Hannover
Tel.: 0049/ 511/ 1690 -620
KAthen@t-online.de
 
8th International Cave Bear Symposium, Kirchheim/Teck, 21.09.2002
© KAthen

home

UP